Using rrdtool
RRDTool and Round Robin Databases
A round-robin database (rrd) is basically a fixed size database that will overwrite the oldest data when all the other spaces have been used. This behavior is common with caches using the least recently used approach, for example. However, it seems a little odd for databases - after all, you want to store things and that is why you put it in a database, right? Well, maybe not entirely right for entirely all data - imagine you wanted to store time series data where old values were aggregated (less detailed information) together and stored elsewhere or where data one year old just doesn't matter anymore.
RRDtool is a round robin database and a suite of tools all in one (graphite is a somewhat nicer alternative). You can store data in RRDtool and retrieve the data or better yet, retrieve plots of the data.
(Update from 2019: DB-Engines ranks RRDtool still comparable to Graphite and Prometheus although Prometheus has been rising very quickly for the last few years. This is likely due to what RRDtool did to open up this field years ago.)
Here are some simple commands for using RRDtool:
sudo yum install rrdtool #install or sudo apt-get install rrdtool
man rrdtool #if you want to read man pages
man rrdcreate #more details on creating an rrd file
Create an example rrd for storing counts of updates versus time - it's made up metric here, but could be a count of hits on a webpage or number of packets on a network interface:
rrdtool create counts.rrd --start 1377510000 \ #set start time if needed
-s 300 DS:count_updt:COUNTER:600:U:U RRA:AVERAGE:0.5:1:12 RRA:AVERAGE:0.5:3:10
#step 300s, COUNTER type, assume null after 600s, Unknown for min, Unknown for max, RRA - round robin aggregation patter: AVERAGE values to consolidate .5 (1/2) values needed to consolidate, every 1 step (maybe silly), 12 times; then another set with .5, 3 steps consolidated, 10 times (step = 5m, 3 steps = 15m, 10 points = 150m)
If you read the manual pages, then you'll see CF frequently. CF is the 'consolidation function' or how RRDtool consolidates data for storage or display in a plot. Above, the CF is AVERAGE, there are others and more sophisticated approaches like Holt-Winters.
Load some data using the Unix timestamp (date +%s). Below, we're loading a number of points starting at 1377510000 which works with the rrd created above. You may need to update this to the current time if you change things.
rrdtool update counts.rrd 1377510000:1234 1377510300:1230 1377510600:1200
rrdtool update counts.rrd 1377510900:1363 1377511200:963 1377511500:1275
rrdtool update counts.rrd 1377511800:1083 1377512100:999 1377512400:1099
rrdtool update counts.rrd 1377512700:1500 1377513000:1810 1377513300:840
Pull the data back to double check - first pull it, then over a time range, then a dump:
rrdtool fetch counts.rrd AVERAGE
rrdtool fetch counts.rrd AVERAGE --start 1377510000 --end 1377513000
rrdtool dump counts.rrd
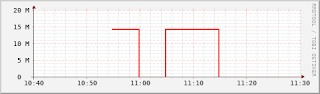
Create an image from the data:
rrdtool graph count_updt.png --start 1377510000 --end 1377513000 DEF:count_updt=counts.rrd:count_updt:AVERAGE LINE2:count_updt#FF0000
DEF:virtual_name=rrd_filename:data-source-name:CF defines a virtual_name for the rrd_filename followed by a data-source-name and consolidation function, but here we've only used one data source (graphite is a little easier for things like this, but once you have the format, rrdtool is fine). LINE2:... means use a line, weight 2, data-source-name and HTML color code.
Check the source docs (here and here) for more details information. Also, read the man pages:
man rrdgraph_data
man rrdgraph_graph
man rrdgraph_examples
Let's create a little more involved one without the rigid time settings. The type has been switched from COUNTER to GAUGE (counter expects increasing values while gauge can vary up and down):
rrdtool create counts1.rrd --start now-7200 DS:count_updt:GAUGE:600:U:U RRA:AVERAGE:0.5:1:12 RRA:AVERAGE:0.5:3:10
Fill with some data - in this case increasing values each time:
i=0; d=`date +%s`
while [ $i -lt 24 ] ; do echo $i; let i=$i+1; let t1=d-7200+300*$i; c=$(($i*500)); echo $t1 $c ; rrdtool update counts1.rrd $t1:$c ; done
Have a look at the data, if you want:
rrdtool dump counts1.rrd
Create a plot:
rrdtool graph count_secd.png --start now-7200 DEF:count_updt=counts1.rrd:count_updt:AVERAGE AREA:count_updt#FF0000

Now, let's create and fill an rrd like the above, but with varying data:
d=`date +%s`
rrdtool create noise.rrd --start=now-7200 DS:noise_meas:GAUGE:600:U:U RRA:AVERAGE:0.5:1:12 RRA:AVERAGE:0.5:3:10
i=1
rrdtool dump noise.rrd
let t=$d-7200
t=$(($d-7200))
while [ $i -lt 24 ] ; do echo $i; let i=$i+1; let t1=t+300*$i; v=`echo $RANDOM`; rrdtool update noise.rrd $t1:$v ; done
rrdtool graph noise.png DEF:noise_meas=noise.rrd:noise_meas:AVERAGE LINE2:noise_meas#00FF00:"example_line\l" -t "Sample Graph" -v "values" -w 500 -h 200 -c BACK#AAAAAA -c GRID#333333
rrdtool graph noise.png --start now-7200 DEF:noise_meas=noise.rrd:noise_meas:AVERAGE AREA:noise_meas#00FF00:"example_line\l" -t "Sample Graph" -v "values" -w 500 -h 200 -c BACK#AAAAAA -c GRID#333333
 Now, let's create a plot with the data from the noise and counts1 data:
rrdtool graph noise_count.png --start now-7200 DEF:noise_meas=noise.rrd:noise_meas:AVERAGE DEF:count_updt=counts1.rrd:count_updt:AVERAGE AREA:noise_meas#00FF00:"example_line\l" LINE2:count_updt#FF0000:"count\l" -t "Sample Graph" -v "values" -w 500 -h 200 -c BACK#AAAAAA -c GRID#333333
 Using with Python
To make RRDtool more useful, it's good to link it with a bit of code to insert data as desired. Here, we're using python-rrdtool is the package (install python-rrdtool) with info here and here. There are other python pages and packages for other libraries.
Using python with rrdtool will require a package install like this: yum install python-rrdtool
Add some python (fairly straight forward, but details depend on the package):
#quick set of python commands for putting rrd data into rrdtool:
from rrdtool import update as rrdtool_update
value = "30"
result = rrdtool_update('counts.rrd', '1552217030:30')
# this was the format for rrdtool-python:
#result = rrdtool_update('test.rrd','N:%s',%(value)) #N means now, otherwise could specify a specific unix timestamp and could send two values if both created in test.rrd 'N:%s:%s',%(value1,value2)
Combine this with some web calls (see the python page on this blog) and you'll be storing time series data quickly! Before you write your own simple receiver, though, have a look at rrdcached which handles receiving metrics
A round-robin database (rrd) is basically a fixed size database that will overwrite the oldest data when all the other spaces have been used. This behavior is common with caches using the least recently used approach, for example. However, it seems a little odd for databases - after all, you want to store things and that is why you put it in a database, right? Well, maybe not entirely right for entirely all data - imagine you wanted to store time series data where old values were aggregated (less detailed information) together and stored elsewhere or where data one year old just doesn't matter anymore.
RRDtool is a round robin database and a suite of tools all in one (graphite is a somewhat nicer alternative). You can store data in RRDtool and retrieve the data or better yet, retrieve plots of the data.
(Update from 2019: DB-Engines ranks RRDtool still comparable to Graphite and Prometheus although Prometheus has been rising very quickly for the last few years. This is likely due to what RRDtool did to open up this field years ago.)
Here are some simple commands for using RRDtool:
sudo yum install rrdtool #install or sudo apt-get install rrdtool
man rrdtool #if you want to read man pages
man rrdcreate #more details on creating an rrd file
Create an example rrd for storing counts of updates versus time - it's made up metric here, but could be a count of hits on a webpage or number of packets on a network interface:
rrdtool create counts.rrd --start 1377510000 \ #set start time if needed
-s 300 DS:count_updt:COUNTER:600:U:U RRA:AVERAGE:0.5:1:12 RRA:AVERAGE:0.5:3:10
#step 300s, COUNTER type, assume null after 600s, Unknown for min, Unknown for max, RRA - round robin aggregation patter: AVERAGE values to consolidate .5 (1/2) values needed to consolidate, every 1 step (maybe silly), 12 times; then another set with .5, 3 steps consolidated, 10 times (step = 5m, 3 steps = 15m, 10 points = 150m)
If you read the manual pages, then you'll see CF frequently. CF is the 'consolidation function' or how RRDtool consolidates data for storage or display in a plot. Above, the CF is AVERAGE, there are others and more sophisticated approaches like Holt-Winters.
Load some data using the Unix timestamp (date +%s). Below, we're loading a number of points starting at 1377510000 which works with the rrd created above. You may need to update this to the current time if you change things.
rrdtool update counts.rrd 1377510000:1234 1377510300:1230 1377510600:1200
rrdtool update counts.rrd 1377510900:1363 1377511200:963 1377511500:1275
rrdtool update counts.rrd 1377511800:1083 1377512100:999 1377512400:1099
rrdtool update counts.rrd 1377512700:1500 1377513000:1810 1377513300:840
Pull the data back to double check - first pull it, then over a time range, then a dump:
rrdtool fetch counts.rrd AVERAGE
rrdtool fetch counts.rrd AVERAGE --start 1377510000 --end 1377513000
rrdtool dump counts.rrd
Create an image from the data:
rrdtool graph count_updt.png --start 1377510000 --end 1377513000 DEF:count_updt=counts.rrd:count_updt:AVERAGE LINE2:count_updt#FF0000
DEF:virtual_name=rrd_filename:data-source-name:CF defines a virtual_name for the rrd_filename followed by a data-source-name and consolidation function, but here we've only used one data source (graphite is a little easier for things like this, but once you have the format, rrdtool is fine). LINE2:... means use a line, weight 2, data-source-name and HTML color code.

Check the source docs (here and here) for more details information. Also, read the man pages:
man rrdgraph_data
man rrdgraph_graph
man rrdgraph_examples
Let's create a little more involved one without the rigid time settings. The type has been switched from COUNTER to GAUGE (counter expects increasing values while gauge can vary up and down):
rrdtool create counts1.rrd --start now-7200 DS:count_updt:GAUGE:600:U:U RRA:AVERAGE:0.5:1:12 RRA:AVERAGE:0.5:3:10
Fill with some data - in this case increasing values each time:
i=0; d=`date +%s`
while [ $i -lt 24 ] ; do echo $i; let i=$i+1; let t1=d-7200+300*$i; c=$(($i*500)); echo $t1 $c ; rrdtool update counts1.rrd $t1:$c ; done
Have a look at the data, if you want:
rrdtool dump counts1.rrd
Create a plot:
rrdtool graph count_secd.png --start now-7200 DEF:count_updt=counts1.rrd:count_updt:AVERAGE AREA:count_updt#FF0000

Now, let's create and fill an rrd like the above, but with varying data:
d=`date +%s`
rrdtool create noise.rrd --start=now-7200 DS:noise_meas:GAUGE:600:U:U RRA:AVERAGE:0.5:1:12 RRA:AVERAGE:0.5:3:10
i=1
rrdtool dump noise.rrd
let t=$d-7200
t=$(($d-7200))
while [ $i -lt 24 ] ; do echo $i; let i=$i+1; let t1=t+300*$i; v=`echo $RANDOM`; rrdtool update noise.rrd $t1:$v ; done
rrdtool graph noise.png DEF:noise_meas=noise.rrd:noise_meas:AVERAGE LINE2:noise_meas#00FF00:"example_line\l" -t "Sample Graph" -v "values" -w 500 -h 200 -c BACK#AAAAAA -c GRID#333333
rrdtool graph noise.png --start now-7200 DEF:noise_meas=noise.rrd:noise_meas:AVERAGE AREA:noise_meas#00FF00:"example_line\l" -t "Sample Graph" -v "values" -w 500 -h 200 -c BACK#AAAAAA -c GRID#333333

rrdtool graph noise_count.png --start now-7200 DEF:noise_meas=noise.rrd:noise_meas:AVERAGE DEF:count_updt=counts1.rrd:count_updt:AVERAGE AREA:noise_meas#00FF00:"example_line\l" LINE2:count_updt#FF0000:"count\l" -t "Sample Graph" -v "values" -w 500 -h 200 -c BACK#AAAAAA -c GRID#333333

To make RRDtool more useful, it's good to link it with a bit of code to insert data as desired. Here, we're using python-rrdtool is the package (install python-rrdtool) with info here and here. There are other python pages and packages for other libraries.
Using python with rrdtool will require a package install like this: yum install python-rrdtool
Add some python (fairly straight forward, but details depend on the package):
#quick set of python commands for putting rrd data into rrdtool:
from rrdtool import update as rrdtool_update
value = "30"
result = rrdtool_update('counts.rrd', '1552217030:30')
# this was the format for rrdtool-python:
#result = rrdtool_update('test.rrd','N:%s',%(value)) #N means now, otherwise could specify a specific unix timestamp and could send two values if both created in test.rrd 'N:%s:%s',%(value1,value2)
Combine this with some web calls (see the python page on this blog) and you'll be storing time series data quickly! Before you write your own simple receiver, though, have a look at rrdcached which handles receiving metrics
Comments
Post a Comment